
The 3 Pillars of Observability in Distributed Software Systems[System Design Sundays]
How you can keep track of what goes in distributed systems for better debugging and error tracking.

Hey, it’s your favorite cult leader here 🐱👤
On Sundays, I will go over various Systems Design topics⚙⚙. These can be mock interviews, writeups by various organizations, or overviews of topics that you need to design better systems. 📝📝
To get access to all the articles, support my crippling chocolate milk addiction, and become a premium member of this cult, use the button below-
p.s. you can learn more about the paid plan here.
As software systems grow in scale, keeping track of the various components and modules they utilize in their operations becomes increasingly crucial. As architecture becomes more complex and your systems get more opaque, having a top-level view of your system’s operations will enable your teams to keep things running smoothly and fix your platforms should things go wrong. This is where System Observability comes in.
System observability or having a birds-eye view of off-site components and the communications between them, is the first step in identifying problems in a distributed environment. Why is data observability needed? Put simply: we can’t monitor what we can’t observe, nor can we analyze it. Combining the three pillars of observability helps DevOps and SRE teams get the data they need to deploy an observability architecture. It accelerates time to market and pinpoints the root causes of system failures (source). As teams scale and up and architecture becomes more distributed, improving a software system’s observability becomes increasingly important. Presently, 87% of organizations employ specialists that work exclusively on observability projects. To those of you looking to gain roles in one of the more competitive companies- this might be your golden ticket.
Research shows that by 2026, seventy percent of organizations that successfully applied observability will achieve shorter latency for decision making, enabling competitive advantage for target business or IT processes.
In today’s article/post, we will be talking about the 3 pillars of observability. If you’re looking to improve the observability of your systems, you should look to build your solution around these 3 pillars. Without further ado, let’s get into these pillars, how they help, and how you should combine them for ideal results.
Understanding the 3 Pillars of Observability
Pillar 1 Logs- Specific, timestamped events. If an application crashes, the error message and timestamp will be written in the logs. These are great for storing the results and processes in a way that can be queried and studied later. If you’re someone looking to build internal tools to improve your orgs productivity, detailed logs will be a great place to study where things go wrong a lot.
Pillar 2 Metrics - Quantifiable statistics about your system like CPU utilization, memory usage, network latencies, etc. This can be great to gain snapshots of system performance, which can be especially helpful when your logs are too unwieldy/messy to look through quickly.
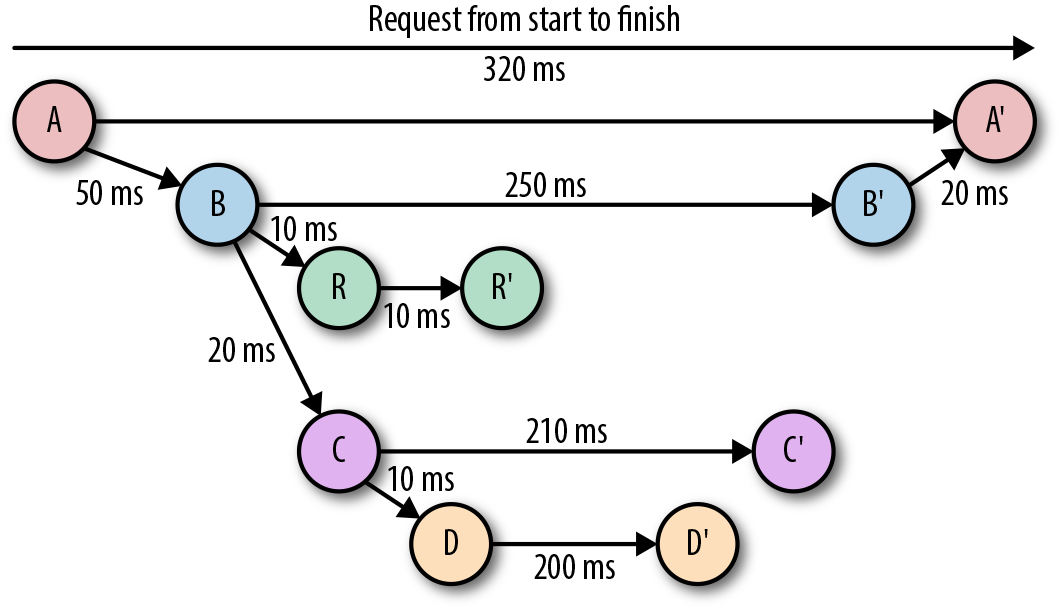
Pillar 3 Traces - A representation of all the events that happened as a request flows through your system. If we take Substack as an example, a trace could be the list of services/functions that get called as I start typing an article, add some images to it, and then share it with y’all. This would be one journey for an article and a trace would be used to capture it/identify the stage where something goes wrong.
Improving upon these pillars- As I’ve covered extensively in the past, it is important to visualize your data to catch patterns. There are a lot of nuances that are only captured in images. Too many teams overlook this and only focus on text/numbers. Don’t make this mistake.
What are the criteria for good observability tools?: This article provides a great list of criteria for great observability tools-
Integrate with current tools: If your observability tools don’t work with your current stack, your observability efforts will fail. Make sure they support the frameworks and languages in your environment, container platform, messaging platform and any other critical software.
Be user-friendly: If your observability tools are hard to learn or use, they won’t get added to workflows, preventing your observability initiative from getting off the ground.
Supply real-time data: Your observability tools should provide the relevant insights via dashboards, reports and queries in real time so teams can understand an issue, its impact and how to resolve it.
Support modern event-handling techniques: Effective observability tools should be able to collect all relevant information from across your stacks, technologies and operating environments; separate valuable signals from the noise, and add enough context so that teams can address it.
Visualize aggregated data: Observability tools should surface insights in easily digestible formats, such as dashboards, interactive summaries and other visualizations that users can comprehend quickly.
Provide context: When an incident arises, your tools should provide enough context for you to understand how your system’s performance has changed over time, how the change relates to other changes in the system, the scope of the issue and any interdependencies of the affected service or component. Without context at the level that observability can provide, incident response is crippled.
Use machine learning: Your tools should include machine learning models that automate data processing and curation, so you can detect and respond to anomalies and other security incidents faster.
Deliver business value: Make sure you’re evaluating your observability tool against metrics important to your business, like deployment speed, system stability and customer experience.
Let’s explore these ideas in more detail.

Logs for Observability
Starting off first, we go to one of the mainstays of the Observability space- logs. An event log is an immutable, timestamped record of discrete events that happened over time. Event logs may come in various forms but have the same fundamental structure: a timestamp and a payload of some context. There are 3 overarching types of logs you will see, based on how they are engineered:
Plaintext: A log record represented free-form text.
Structured: This involves writing logs in a pre-specified format (like JSON). This can be very helpful in parsing through large log dumps (especially if you plan to write some kind of software for it). Would recommend implementing this to some capacity
Binary: If you need logs for system purposes (replication, verification, reverting changes etc) then you can store them in some kind of binary format. This writeup by MySQL is a good one on binary logs.
Debugging rare events (complete system crashes) requires a lot of detail. Event logs, shine in these cases. As such, event logs are especially helpful for uncovering emergent and unpredictable behaviors exhibited by components of a distributed system.
Logs are very easy to generate, and will probably be the most frequent pillar that your system spits out. This volume can be a curse if not handled correctly. Building a search capability to quickly parse through logs to and building AI to identify patterns in them is a great way to add serious value to your teams. If you’re a developer operating on stand-by/working on a project that doesn’t seem particularly exciting to you, attacking logs is always a great way to uncover some gems.
Using Metrics for Observability
This is an additional level of abstraction built on top of logs. Logs are typically taken directly from the system operations, with very little processing done to them. A metric on the other hand, is a numeric value measured over an interval of time. It includes specific attributes such as timestamp, name, KPIs, and value. Unlike logs, metrics are structured by default, which makes it easier to query and optimize for storage, giving you the ability to retain them for longer periods. They can be much easier to read, since they give you a lot of information at a glance (think back to how useful tables are in day-day lives).

As a Data Scientist/ML Engineer, I see many statistically oriented teams make a crucial mistake- over-indexing on metrics. Remember the quote that the map is not the landscape. At any time, metrics provide a snapshot of the system, often devoid of the context around that. While numbers are important, don’t make the mistake of focusing on the numbers and missing everything else. However done well, metrics are one of the most powerful tools in your arsenal. They’re relatively cheap to store, their numeric natures make them ideal for monitoring, and they can be used to quickly flag issues before they spiral out of control.
These 2 pillars are very powerful by themselves. However, adding a 3rd component to this golden duo allows you to hit the Modric-Kroos-Casemiro trio of software systems. Let’s cover that now.
Traces for Software Observability
Traces are a newer addition to observability, but they are crucial for distributed systems. By viewing traces, each of which includes one or more spans, you can track its course through a distributed system and identify the cause of a bottleneck or breakdown. According to Google’s former distributed tracing expert, Ben Sigelman, distributed traces are the best reverse engineering tool for diagnosing the complicated interference between transactions that are causing issues.
The basic idea behind tracing is straightforward—identify specific points in an application in the path of a request that represents the following:
Forks in execution flow (OS thread or a green thread)
A hop or a fan out across network or process boundaries
Traces can be used to effectively study the system at large and must be integrated into any distributed system. Distributed tracing is useful when requests go through multiple containerized microservices. Traces are easy to use as they are generated automatically, standardized, and show how long each step in the user journey takes. Traces show bars of varying lengths for each step, making it possible to follow requests visually.
Traces are better than logs at providing context for events, but you won’t get code-level visibility into problems as you would with logs. Traces are automatically generated with data visualization. That makes it easier to observe issues and faster to fix them. They lack flexibility and customizability, but they’re designed to go deeper into distributed systems where logs can’t reach.
Combining traces with logs and metrics is a must for building tools to boost the observability of your systems and improve their performance. These will help you a ton for your work.
That is it for this piece. I appreciate your time. As always, if you’re interested in working with me or checking out my other work, my links will be at the end of this email/post. If you like my writing, I would really appreciate an anonymous testimonial. You can drop it here. And if you found value in this write-up, I would appreciate you sharing it with more people. It is word-of-mouth referrals like yours that help me grow

Save the time, energy, and money you would burn by going through all those videos, courses, products, and ‘coaches’ and easily find all your needs met in one place at ‘Tech Made Simple’! Stay ahead of the curve in AI, software engineering, and the tech industry with expert insights, tips, and resources. 20% off for new subscribers by clicking this link. Subscribe now and simplify your tech journey!
Using this discount will drop the prices-
800 INR (10 USD) → 640 INR (8 USD) per Month
8000 INR (100 USD) → 6400INR (80 USD) per year (533 INR /month)
Reach out to me
Use the links below to check out my other content, learn more about tutoring, reach out to me about projects, or just to say hi.
Small Snippets about Tech, AI and Machine Learning over here
AI Newsletter- https://artificialintelligencemadesimple.substack.com/
My grandma’s favorite Tech Newsletter- https://codinginterviewsmadesimple.substack.com/
Check out my other articles on Medium. : https://rb.gy/zn1aiu
My YouTube: https://rb.gy/88iwdd
Reach out to me on LinkedIn. Let’s connect: https://rb.gy/m5ok2y
My Instagram: https://rb.gy/gmvuy9
My Twitter: https://twitter.com/Machine01776819